> ## Documentation Index
> Fetch the complete documentation index at: https://docs.thefaithapp.com/llms.txt
> Use this file to discover all available pages before exploring further.
# Analytics
> Review engagement, content activity, demographics, cohorts, notifications, app versions, and alert-driven analytics workflows in TheFaithApp.
# Analytics
This guide covers the analytics workspace used to understand engagement, audience trends, app adoption, and alert-based monitoring in TheFaithApp.
These tools include:
* Analytics dashboard
* Engagement analytics
* Content analytics
* Demographics analytics
* Cohort analysis
* Notification analytics
* App version analytics
* Custom metrics
* Analytics alerts
## Before You Start
* Sign in to your admin account.
* Open `Analytics` from the five-product sidebar, then choose the analytics page you need.
* Use the date range and platform filters when you want to narrow the results.
* Some analytics areas may show limited or empty data until your app has enough tracked usage.
## Analytics Dashboard
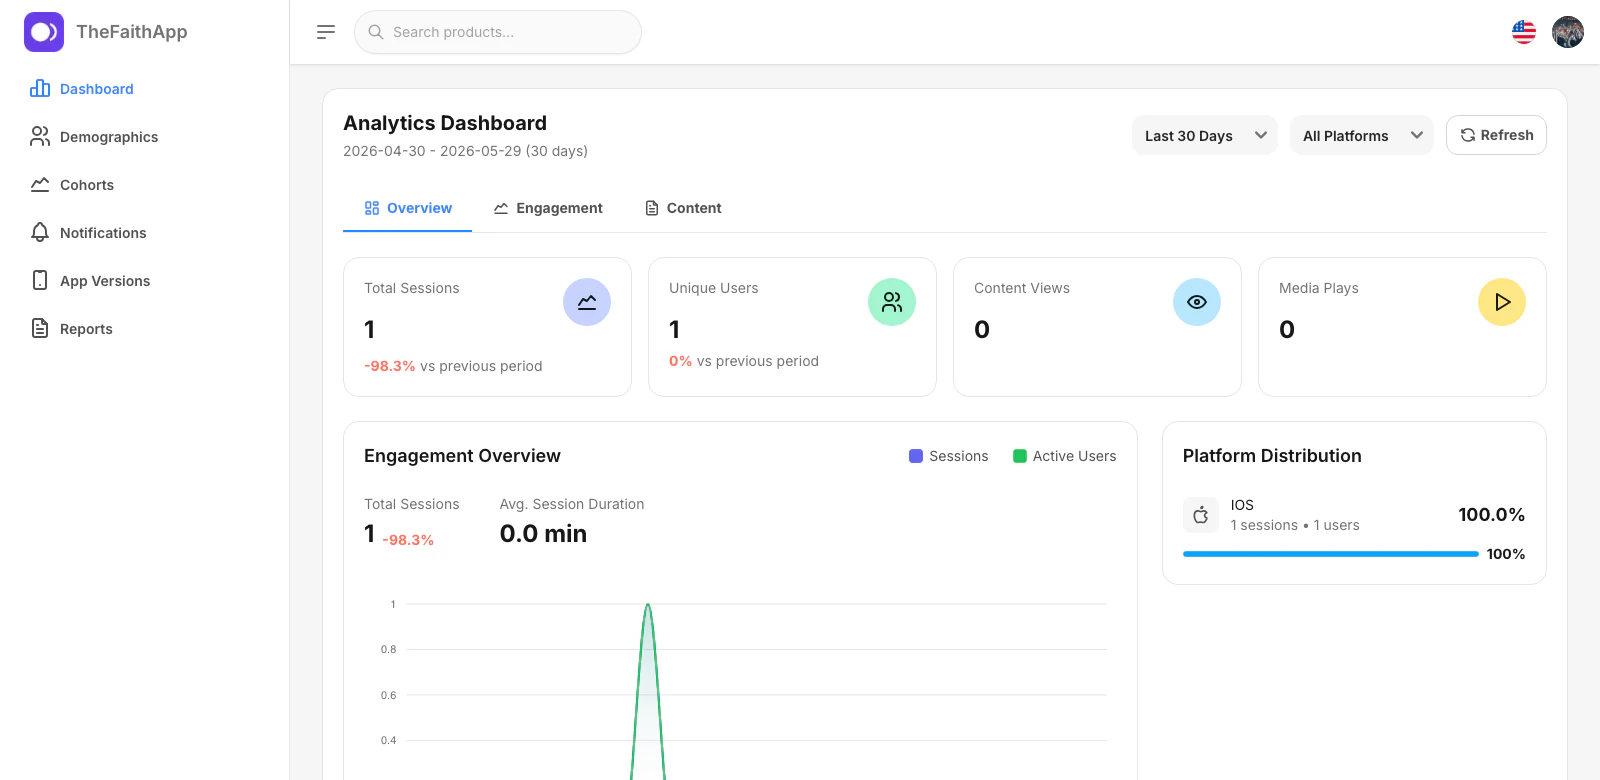
Use the main dashboard when you want one place to review sessions, users, engagement trends, and content performance.
 ### What You Can Do
* Review session and user totals
* Check content views and media plays
* Compare current activity to the previous period
* Review engagement charts
* See platform distribution
### Steps
1. Open `Analytics`.
2. Stay on `Dashboard`.
3. Review the top cards first.
4. Use the date range and platform filters when you need a narrower view.
5. Click `Refresh` if you want to reload the latest totals.
### Notes
* The dashboard is the best first stop for day-to-day performance review.
* `Overview`, `Engagement`, and `Content` are tabs inside the main analytics dashboard, not separate left-nav pages.
## Engagement Analytics
Use the `Engagement` tab when you want to focus on sessions, new users, session duration, bounce rate, and device activity.
### What You Can Do
* Review session and user totals
* Check content views and media plays
* Compare current activity to the previous period
* Review engagement charts
* See platform distribution
### Steps
1. Open `Analytics`.
2. Stay on `Dashboard`.
3. Review the top cards first.
4. Use the date range and platform filters when you need a narrower view.
5. Click `Refresh` if you want to reload the latest totals.
### Notes
* The dashboard is the best first stop for day-to-day performance review.
* `Overview`, `Engagement`, and `Content` are tabs inside the main analytics dashboard, not separate left-nav pages.
## Engagement Analytics
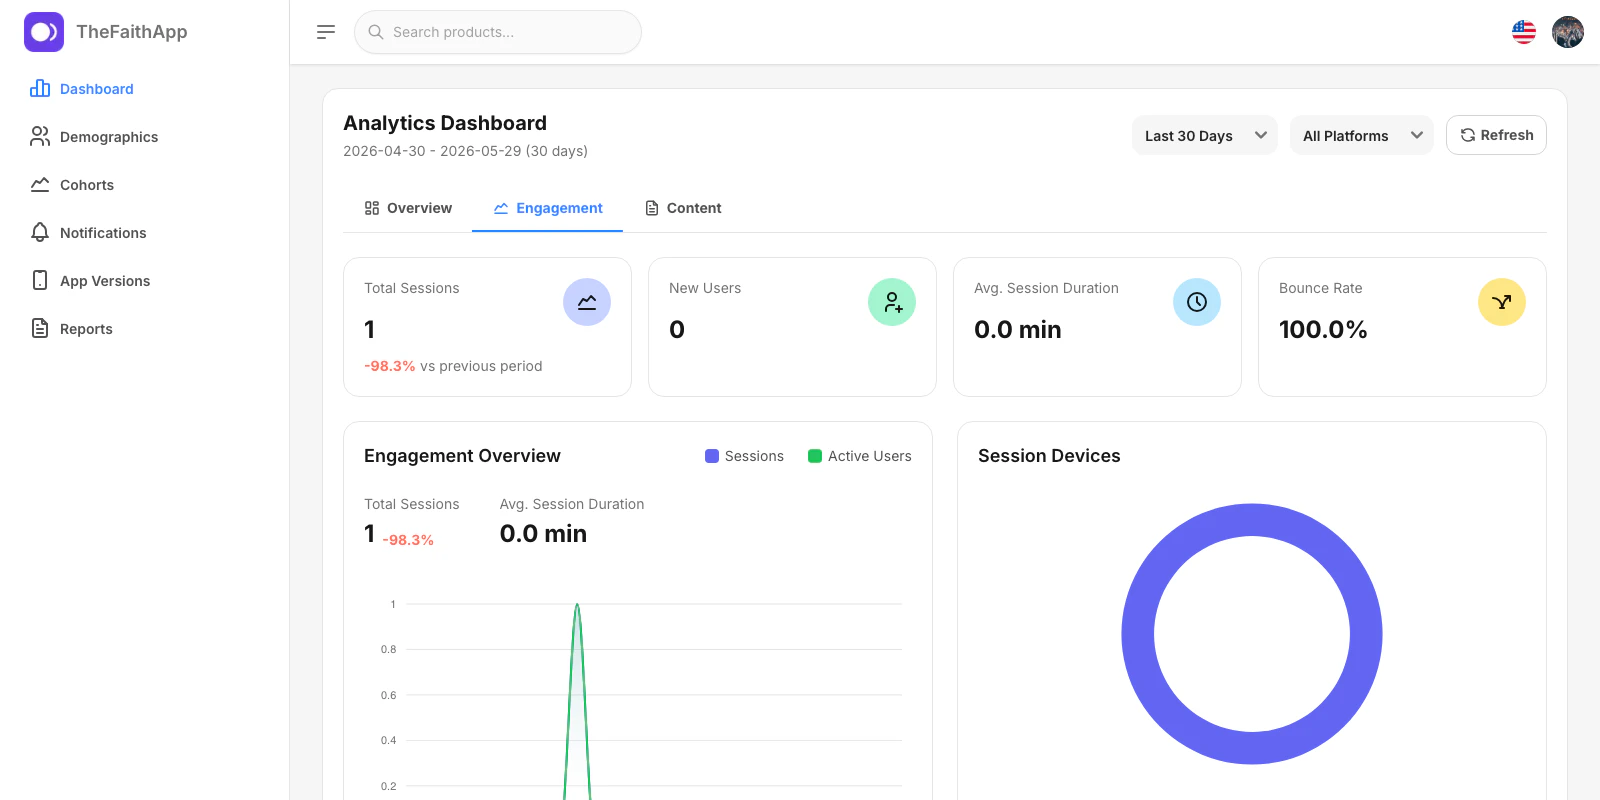
Use the `Engagement` tab when you want to focus on sessions, new users, session duration, bounce rate, and device activity.
 ### What You Can Do
* Review total sessions
* Review new users
* Check average session duration
* Monitor bounce rate
* Compare activity by device
### Steps
1. Open `Analytics`.
2. Click the `Engagement` tab.
3. Review the top engagement cards.
4. Use the chart and device panel to understand how people are using the app.
### Notes
* This view is useful when you want to understand usage quality, not just raw traffic.
## Content Analytics
Use the `Content` tab when you want to review how sermons, media, and other content are performing.
### What You Can Do
* Review total sessions
* Review new users
* Check average session duration
* Monitor bounce rate
* Compare activity by device
### Steps
1. Open `Analytics`.
2. Click the `Engagement` tab.
3. Review the top engagement cards.
4. Use the chart and device panel to understand how people are using the app.
### Notes
* This view is useful when you want to understand usage quality, not just raw traffic.
## Content Analytics
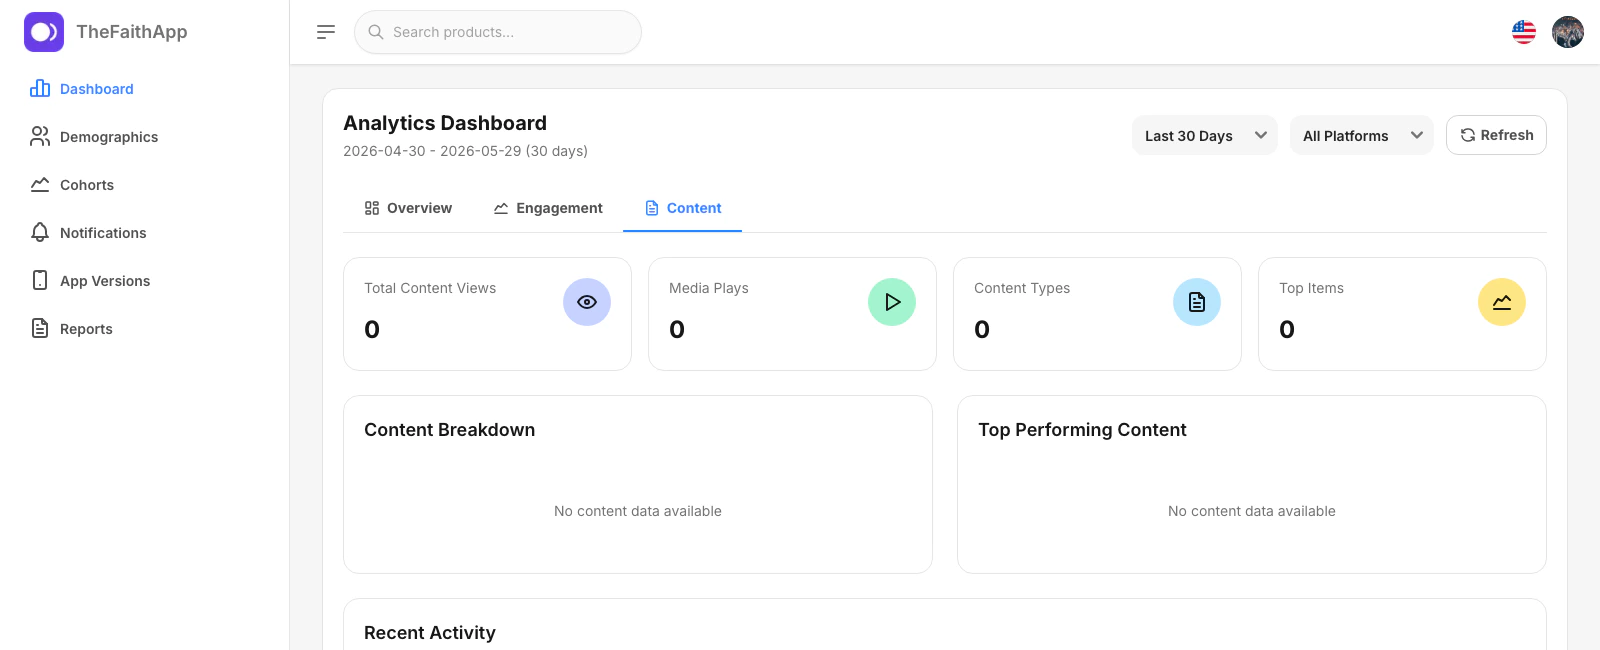
Use the `Content` tab when you want to review how sermons, media, and other content are performing.
 ### What You Can Do
* Review total content views
* Review media plays
* See how many content types are active
* Review top-performing content
* Check whether content activity is available for the selected date range
### Steps
1. Open `Analytics`.
2. Click the `Content` tab.
3. Review the top content cards.
4. Use the content breakdown and top-performing content panels to understand what people are consuming.
### Notes
* Empty content panels usually mean the selected period has little or no tracked content activity yet.
## Demographics Analytics
Use demographics analytics when you want to understand the makeup of your audience and how complete your user profile data is.
### What You Can Do
* Review total content views
* Review media plays
* See how many content types are active
* Review top-performing content
* Check whether content activity is available for the selected date range
### Steps
1. Open `Analytics`.
2. Click the `Content` tab.
3. Review the top content cards.
4. Use the content breakdown and top-performing content panels to understand what people are consuming.
### Notes
* Empty content panels usually mean the selected period has little or no tracked content activity yet.
## Demographics Analytics
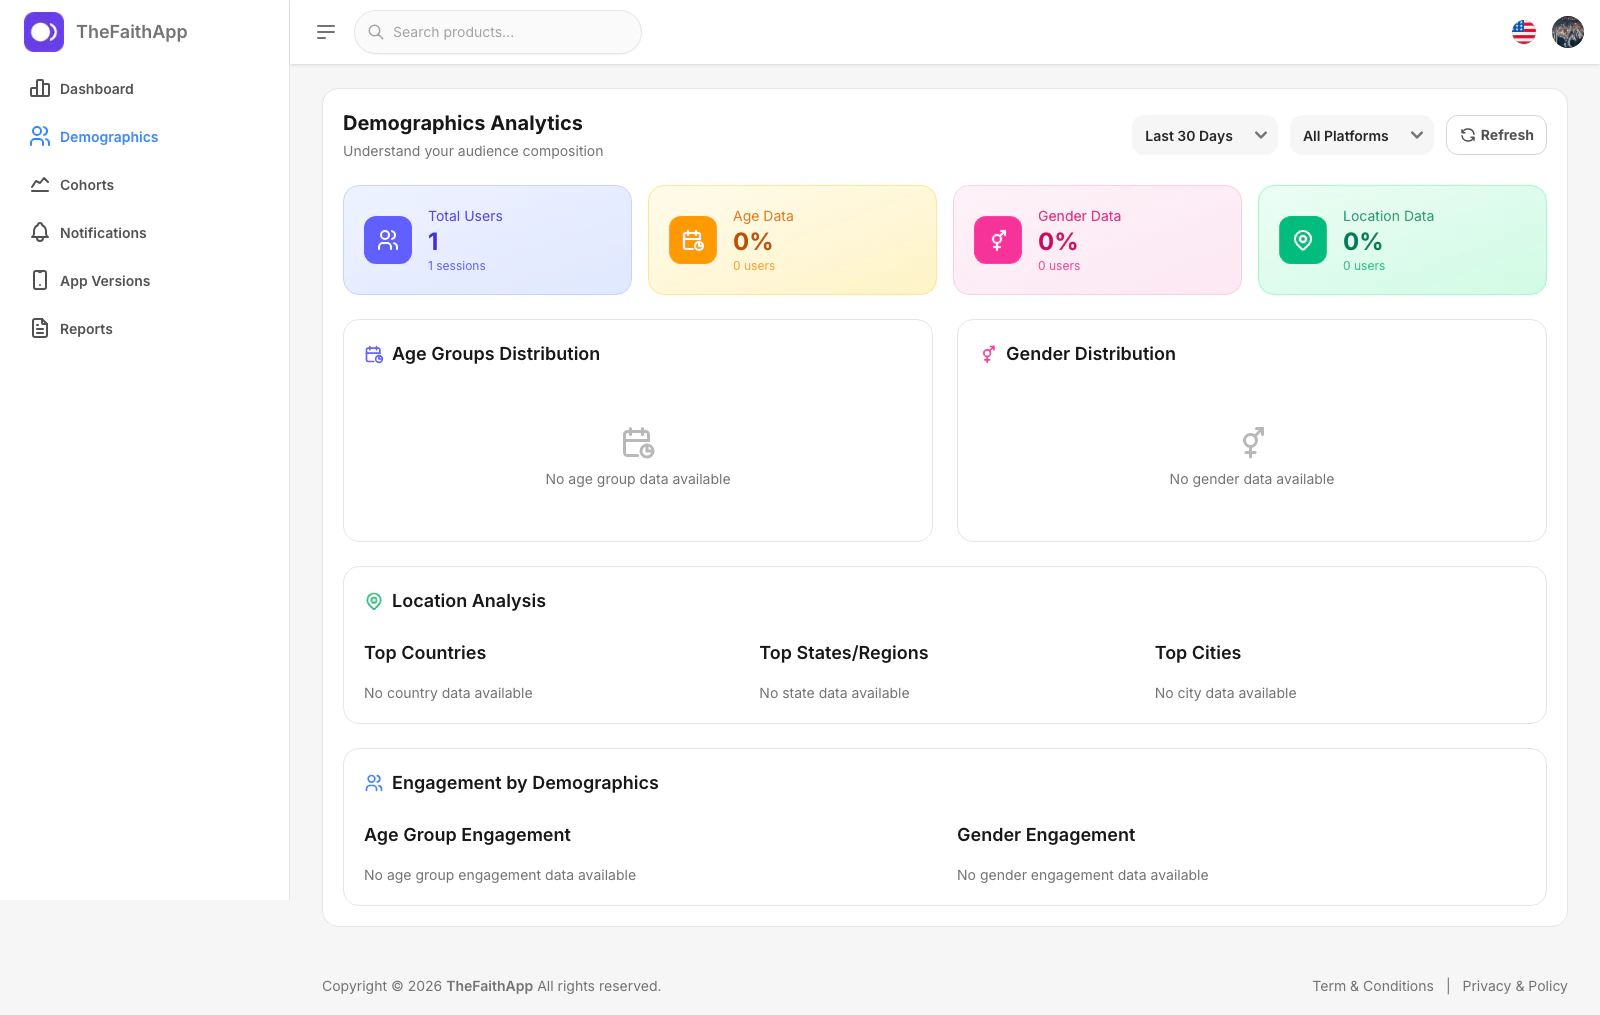
Use demographics analytics when you want to understand the makeup of your audience and how complete your user profile data is.
 ### What You Can Do
* Review total users and sessions
* Check age, gender, and location data coverage
* Review age group distribution
* Review gender distribution
* Review top countries, regions, and cities
### Steps
1. Open `Analytics`.
2. Click `Demographics`.
3. Review the summary cards at the top.
4. Scroll down to the age, gender, and location sections.
5. Use the date range or platform filters if you want a narrower audience view.
### Notes
* Coverage percentages show how much demographic data is actually available in the current user base.
* Empty demographic sections usually mean those user profile fields have not been collected consistently yet.
## Cohort Analysis
Use cohorts when you want to understand retention, churn, and how groups of users behave over time.
### What You Can Do
* Review total users and sessions
* Check age, gender, and location data coverage
* Review age group distribution
* Review gender distribution
* Review top countries, regions, and cities
### Steps
1. Open `Analytics`.
2. Click `Demographics`.
3. Review the summary cards at the top.
4. Scroll down to the age, gender, and location sections.
5. Use the date range or platform filters if you want a narrower audience view.
### Notes
* Coverage percentages show how much demographic data is actually available in the current user base.
* Empty demographic sections usually mean those user profile fields have not been collected consistently yet.
## Cohort Analysis
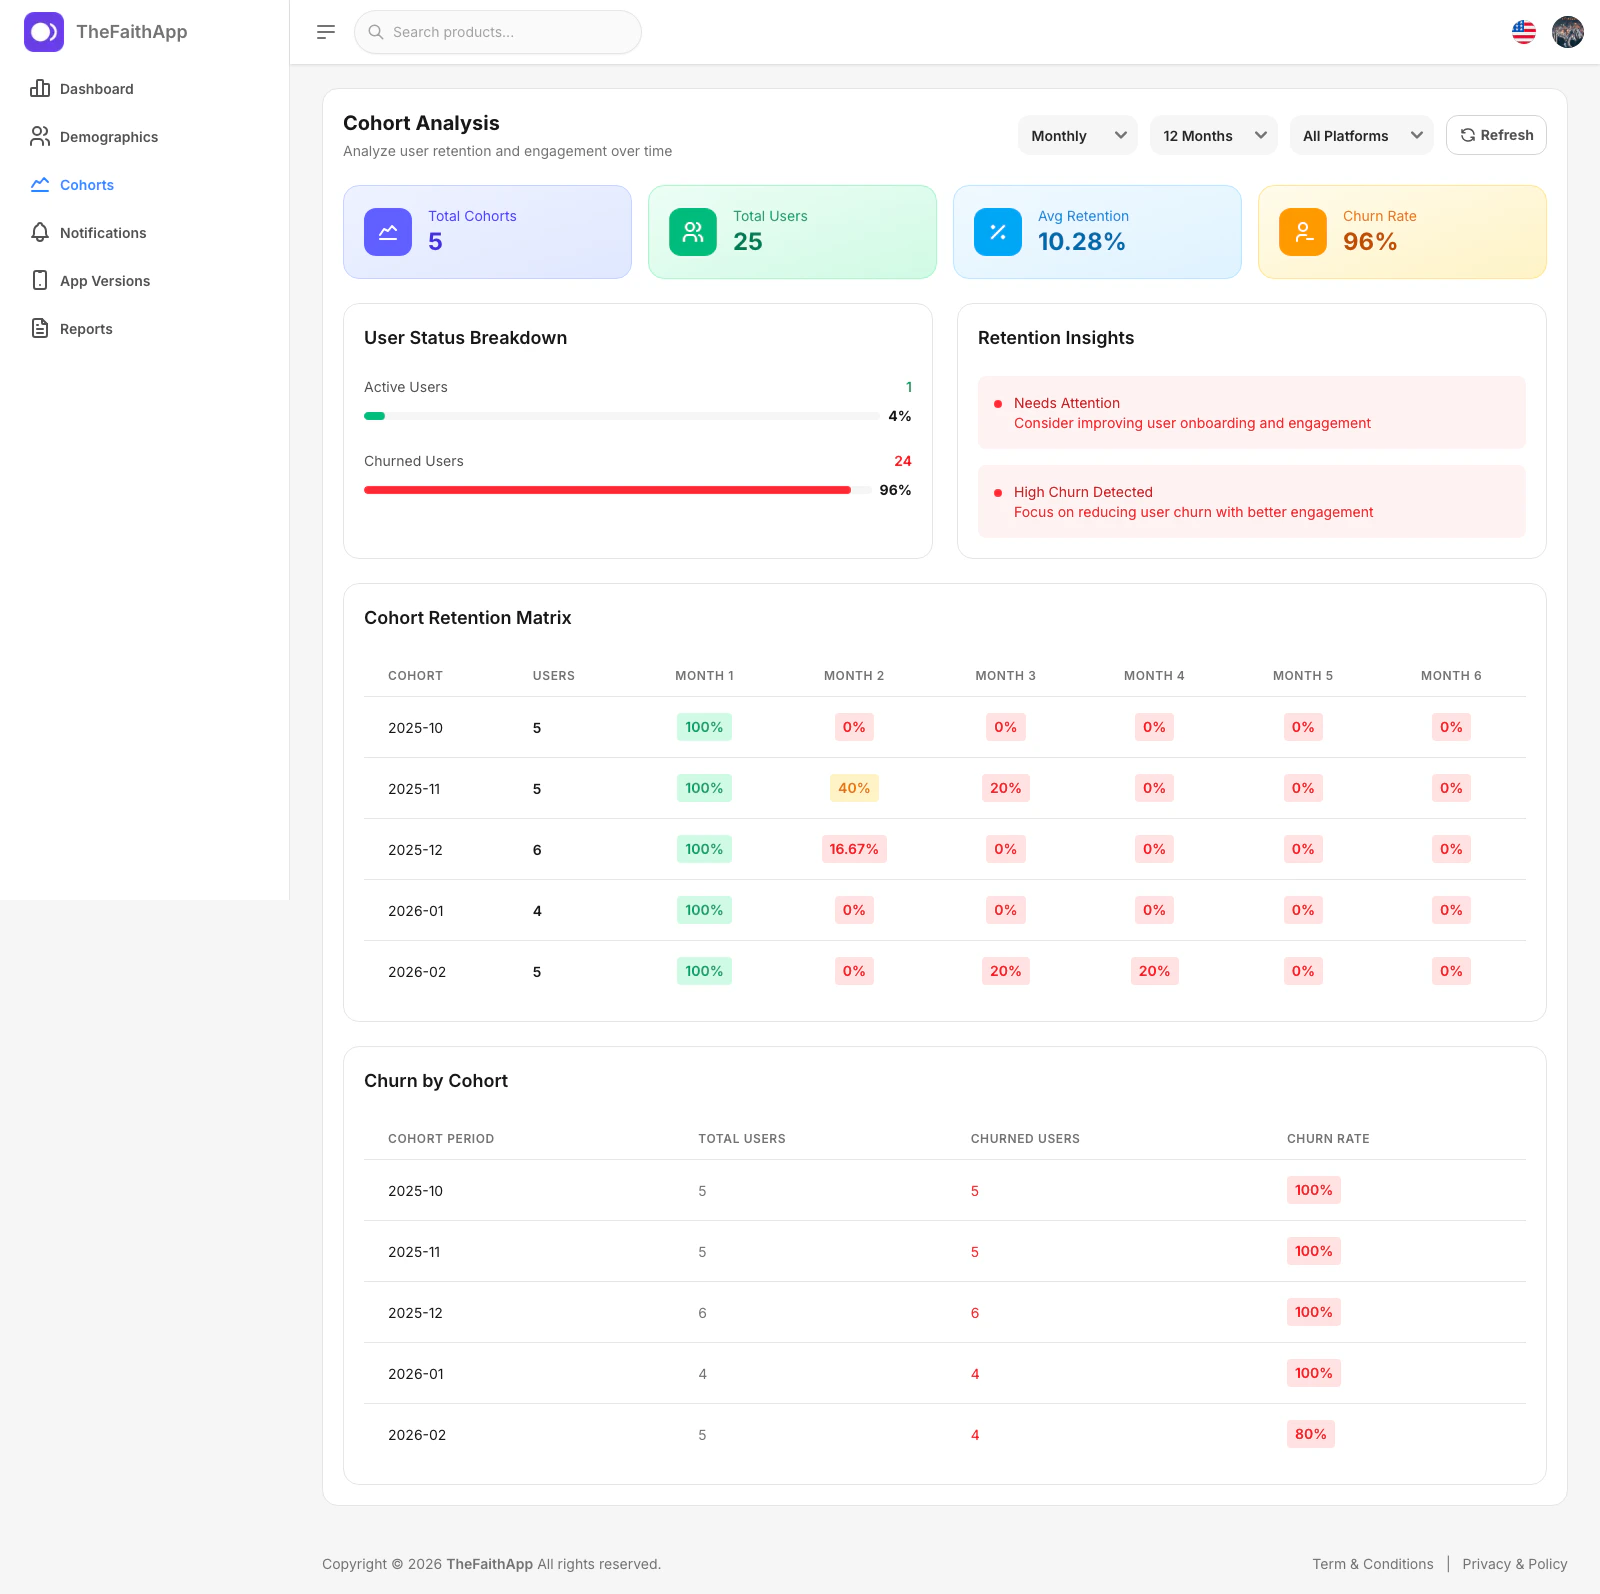
Use cohorts when you want to understand retention, churn, and how groups of users behave over time.
 ### What You Can Do
* Review total cohorts and total users
* Check average retention
* Review churn rate
* Compare active and churned users
* Inspect the cohort retention matrix
* Review churn by cohort period
### Steps
1. Open `Analytics`.
2. Click `Cohorts`.
3. Choose the period and number of months you want to analyze.
4. Review the overview cards first.
5. Use the retention matrix and churn table to study longer-term user behavior.
### Notes
* Cohorts are especially useful when your team wants to understand how well new users stay engaged after joining.
## Notification Analytics
Use notification analytics when you want to measure delivery and engagement for push notifications.
### What You Can Do
* Review total cohorts and total users
* Check average retention
* Review churn rate
* Compare active and churned users
* Inspect the cohort retention matrix
* Review churn by cohort period
### Steps
1. Open `Analytics`.
2. Click `Cohorts`.
3. Choose the period and number of months you want to analyze.
4. Review the overview cards first.
5. Use the retention matrix and churn table to study longer-term user behavior.
### Notes
* Cohorts are especially useful when your team wants to understand how well new users stay engaged after joining.
## Notification Analytics
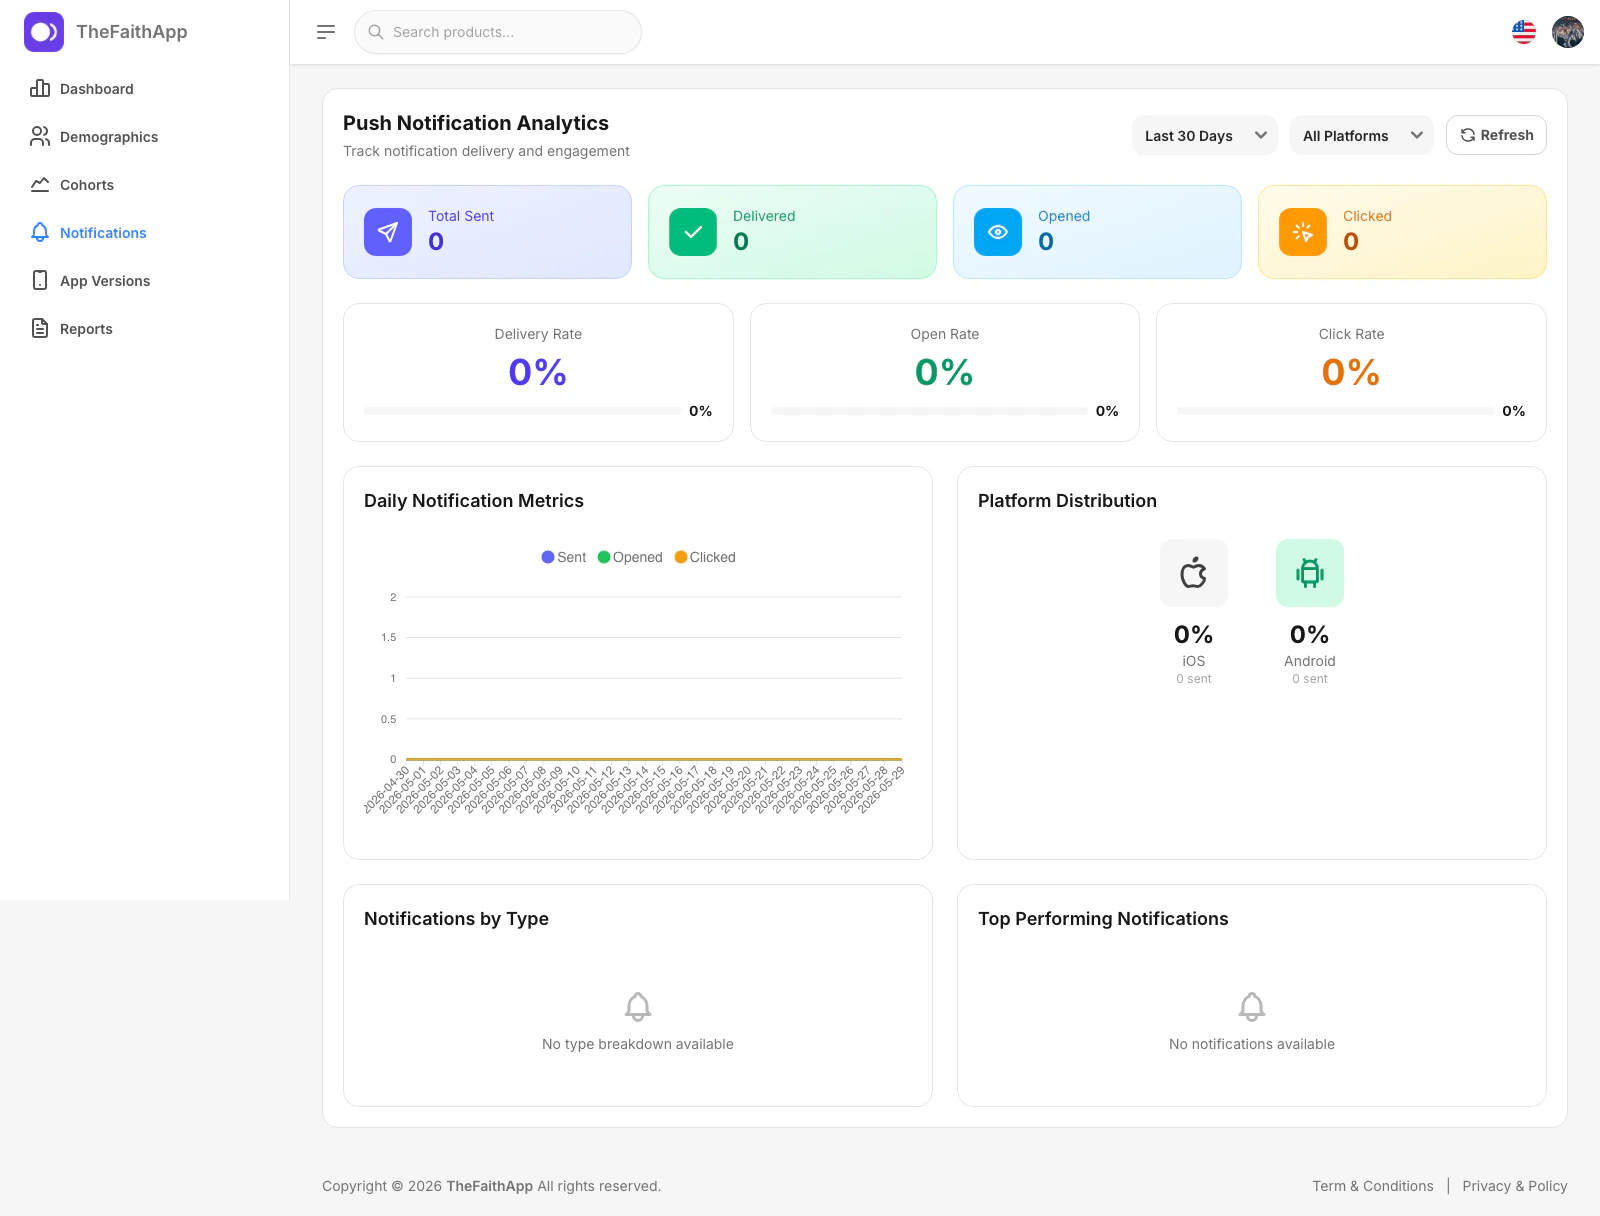
Use notification analytics when you want to measure delivery and engagement for push notifications.
 ### What You Can Do
* Review total notifications sent
* Review delivered, opened, and clicked totals
* Check delivery, open, and click rates
* Review daily notification activity
* Compare notification activity by platform
* Review top-performing notifications
### Steps
1. Open `Analytics`.
2. Click `Notifications`.
3. Review the delivery and engagement cards at the top.
4. Scroll to the chart, platform split, and top notification sections.
5. Use the filters if you want to isolate one platform or period.
### Notes
* This page is useful for judging both technical delivery and audience response.
* Empty notification sections usually mean there has not been enough notification activity in the selected period.
## App Version Analytics
Use app version analytics when you want to track adoption of newer app releases and spot version-based performance differences.
### What You Can Do
* Review total notifications sent
* Review delivered, opened, and clicked totals
* Check delivery, open, and click rates
* Review daily notification activity
* Compare notification activity by platform
* Review top-performing notifications
### Steps
1. Open `Analytics`.
2. Click `Notifications`.
3. Review the delivery and engagement cards at the top.
4. Scroll to the chart, platform split, and top notification sections.
5. Use the filters if you want to isolate one platform or period.
### Notes
* This page is useful for judging both technical delivery and audience response.
* Empty notification sections usually mean there has not been enough notification activity in the selected period.
## App Version Analytics
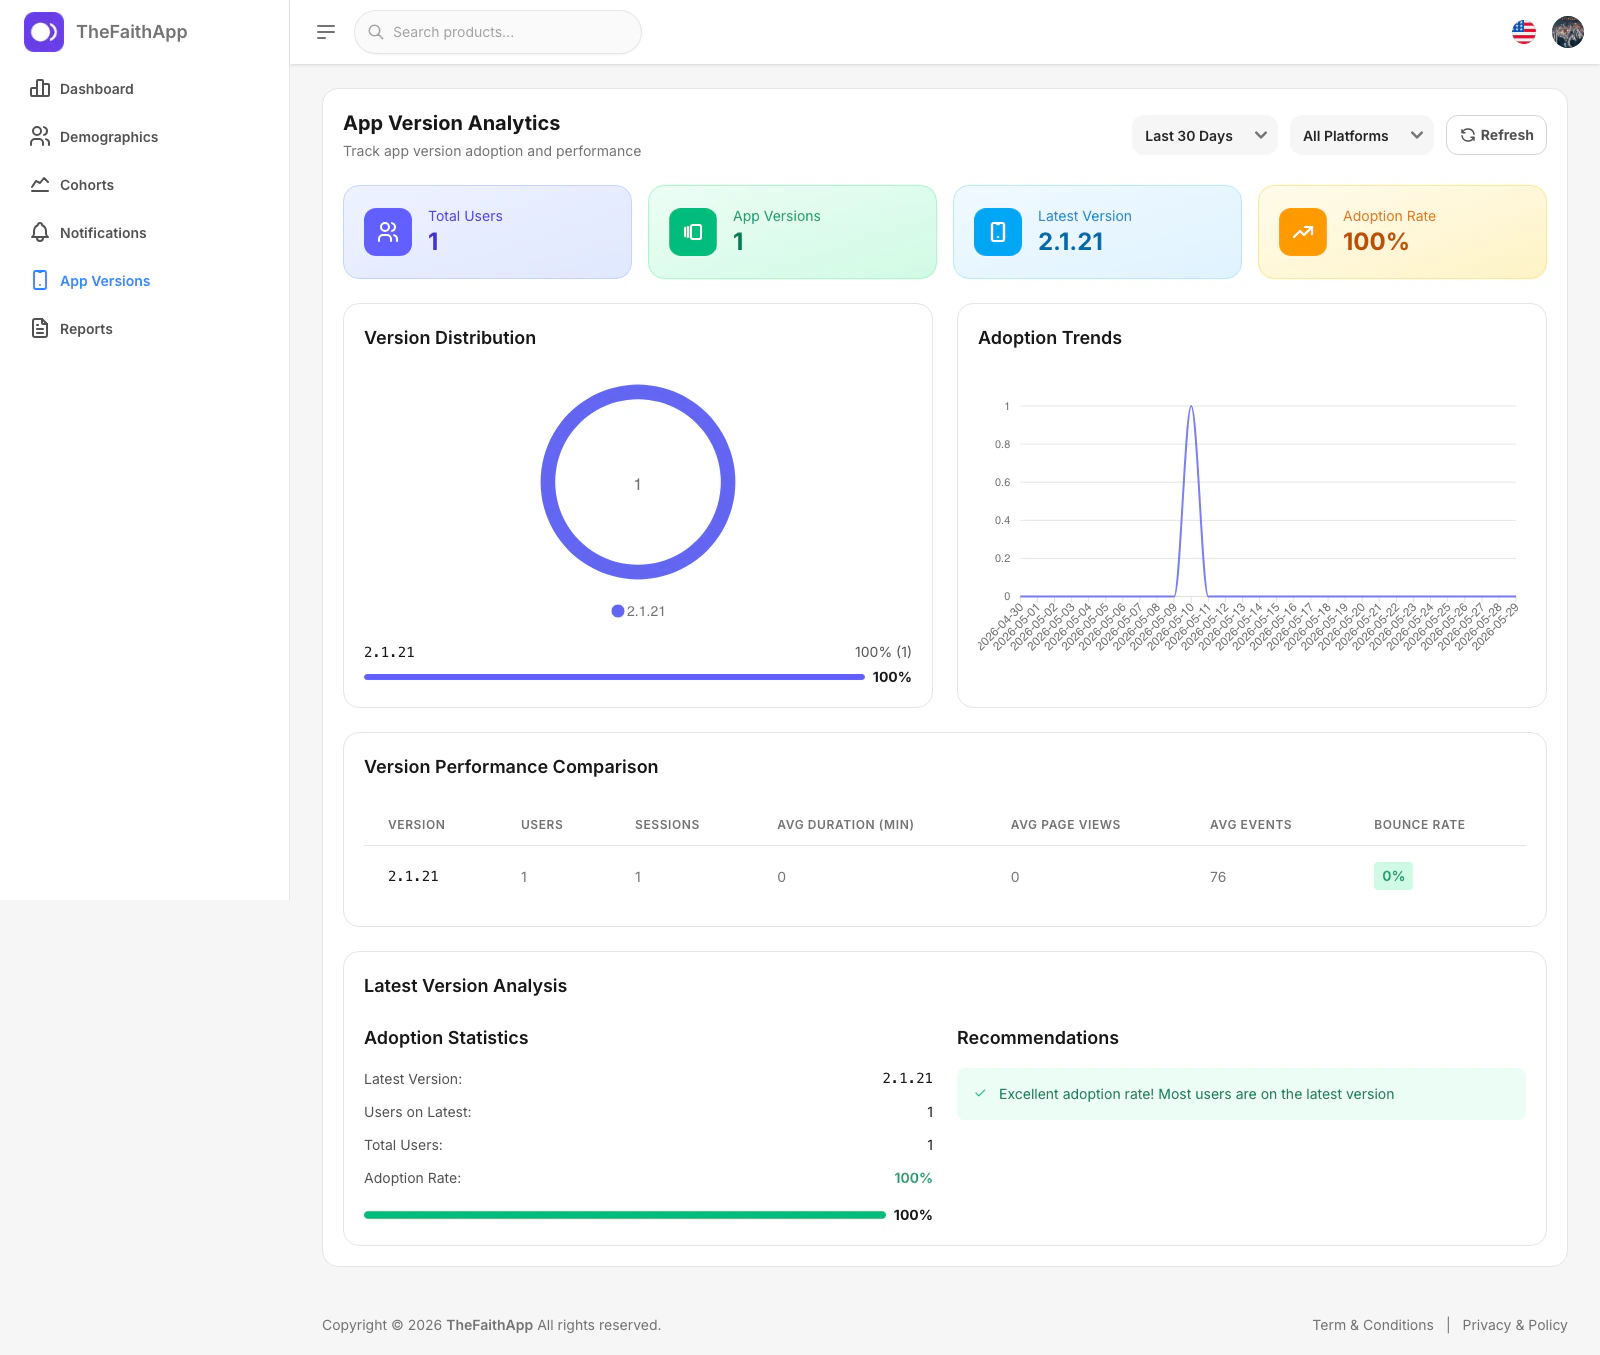
Use app version analytics when you want to track adoption of newer app releases and spot version-based performance differences.
 ### What You Can Do
* Review the latest app version in use
* Check the adoption rate for the latest release
* Compare users across app versions
* Review adoption trends over time
* Compare version performance
* Review latest-version recommendations
### Steps
1. Open `Analytics`.
2. Click `App Versions`.
3. Review the top adoption cards.
4. Use the version distribution and adoption trend sections to see how upgrades are spreading.
5. Review the performance comparison table for version-specific differences.
### Notes
* This view is especially helpful when you are encouraging users to upgrade to a newer app release.
## Alerts And Metrics
Use the reports area when you want to manage backend-driven custom metrics and analytics alerts.
### What You Can Do
* Review the latest app version in use
* Check the adoption rate for the latest release
* Compare users across app versions
* Review adoption trends over time
* Compare version performance
* Review latest-version recommendations
### Steps
1. Open `Analytics`.
2. Click `App Versions`.
3. Review the top adoption cards.
4. Use the version distribution and adoption trend sections to see how upgrades are spreading.
5. Review the performance comparison table for version-specific differences.
### Notes
* This view is especially helpful when you are encouraging users to upgrade to a newer app release.
## Alerts And Metrics
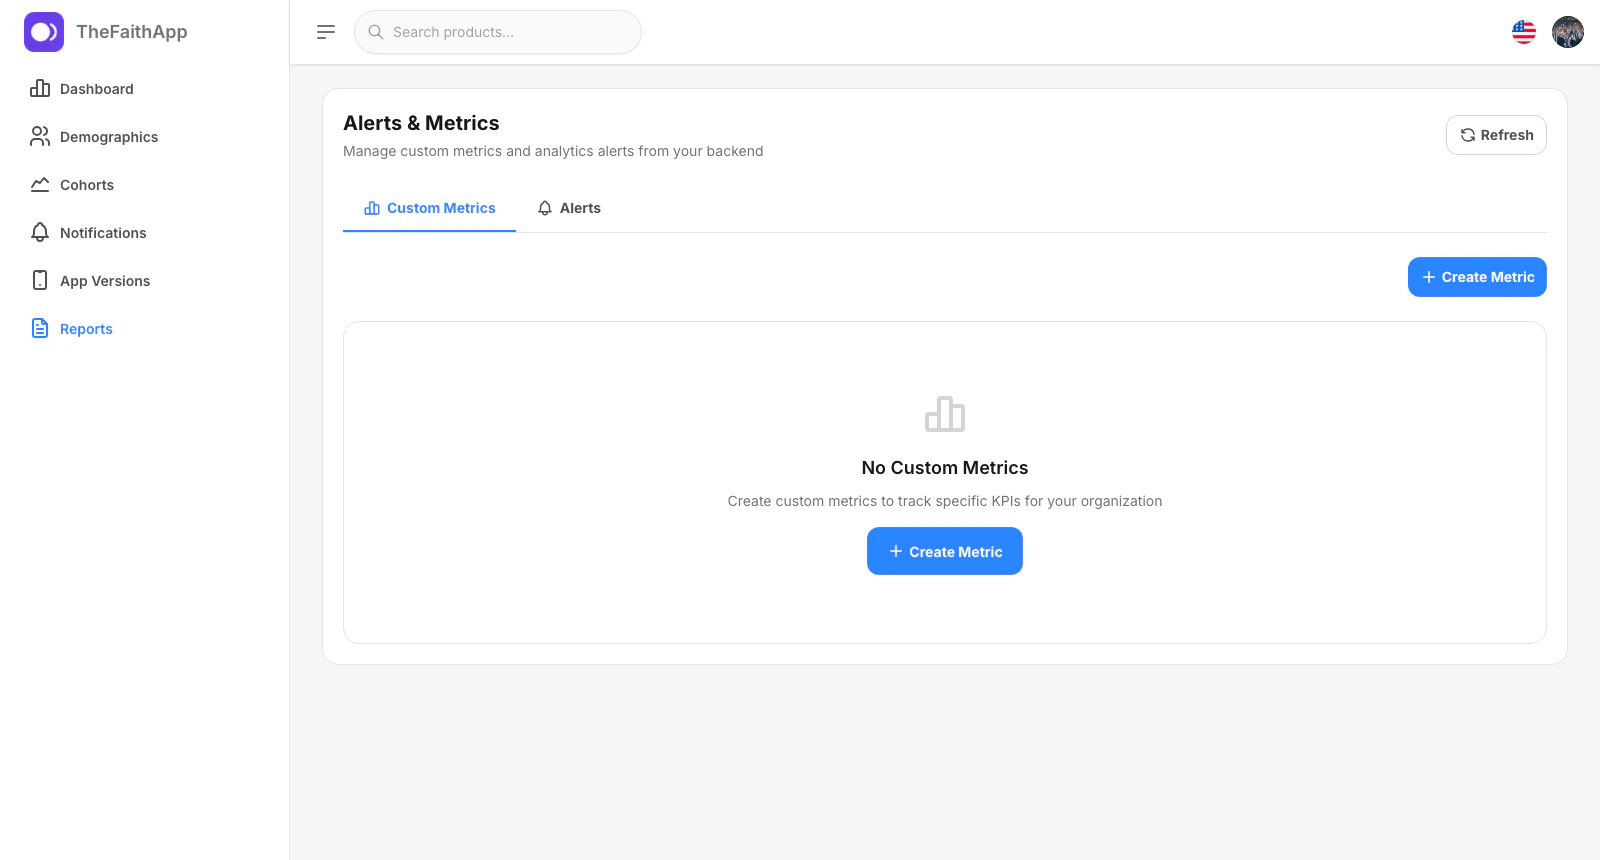
Use the reports area when you want to manage backend-driven custom metrics and analytics alerts.
 ### What You Can Do
* Create custom metrics
* Review whether custom metrics are active
* Create analytics alerts
* Review alert totals, active alerts, and alerts triggered today
### Steps
1. Open `Analytics`.
2. Click `Reports`.
3. Stay on `Custom Metrics` when you want to manage saved metric definitions.
4. Open `Alerts` when you want to manage threshold-based alerts.
5. Click `Refresh` when you want to reload the latest configuration state.
### Notes
* This page currently focuses on custom metrics and alerts.
* The reports workspace is useful for teams that want more tailored monitoring than the default dashboard cards provide.
## Custom Metrics
Use custom metrics when your team wants to define a KPI that is more specific to your ministry or organization.
### What You Can Do
* Create custom metrics
* Review whether custom metrics are active
* Create analytics alerts
* Review alert totals, active alerts, and alerts triggered today
### Steps
1. Open `Analytics`.
2. Click `Reports`.
3. Stay on `Custom Metrics` when you want to manage saved metric definitions.
4. Open `Alerts` when you want to manage threshold-based alerts.
5. Click `Refresh` when you want to reload the latest configuration state.
### Notes
* This page currently focuses on custom metrics and alerts.
* The reports workspace is useful for teams that want more tailored monitoring than the default dashboard cards provide.
## Custom Metrics
Use custom metrics when your team wants to define a KPI that is more specific to your ministry or organization.
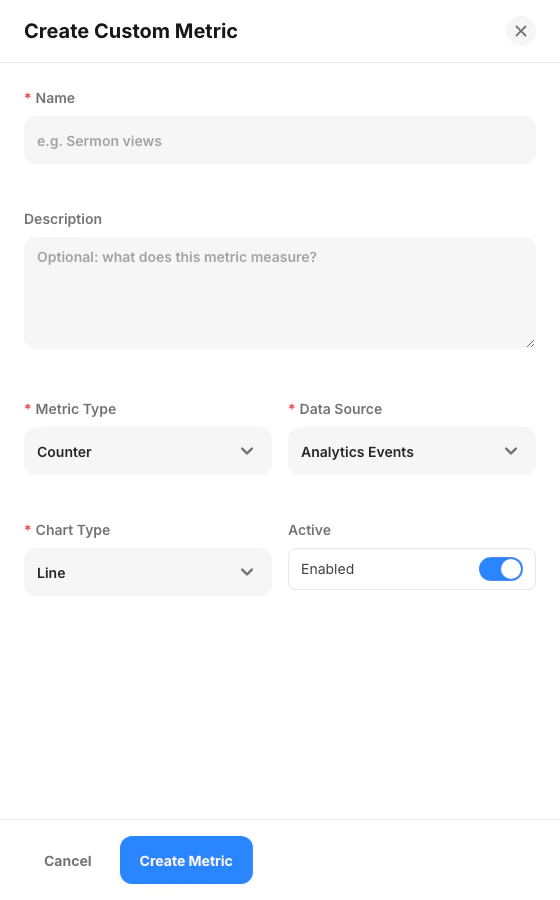 ### What You Can Do
* Name a custom metric
* Add a description
* Choose the metric type
* Choose the data source
* Choose the chart type
* Turn the metric on or off
### Steps
1. Open `Analytics`.
2. Click `Reports`.
3. Stay on `Custom Metrics`.
4. Click `Create Metric`.
5. Complete the metric details and save it.
### Notes
* Custom metrics are useful when standard dashboard totals do not answer a recurring business question.
## Analytics Alerts
Use alerts when you want TheFaithApp to flag important changes in your analytics thresholds.
### What You Can Do
* Name a custom metric
* Add a description
* Choose the metric type
* Choose the data source
* Choose the chart type
* Turn the metric on or off
### Steps
1. Open `Analytics`.
2. Click `Reports`.
3. Stay on `Custom Metrics`.
4. Click `Create Metric`.
5. Complete the metric details and save it.
### Notes
* Custom metrics are useful when standard dashboard totals do not answer a recurring business question.
## Analytics Alerts
Use alerts when you want TheFaithApp to flag important changes in your analytics thresholds.
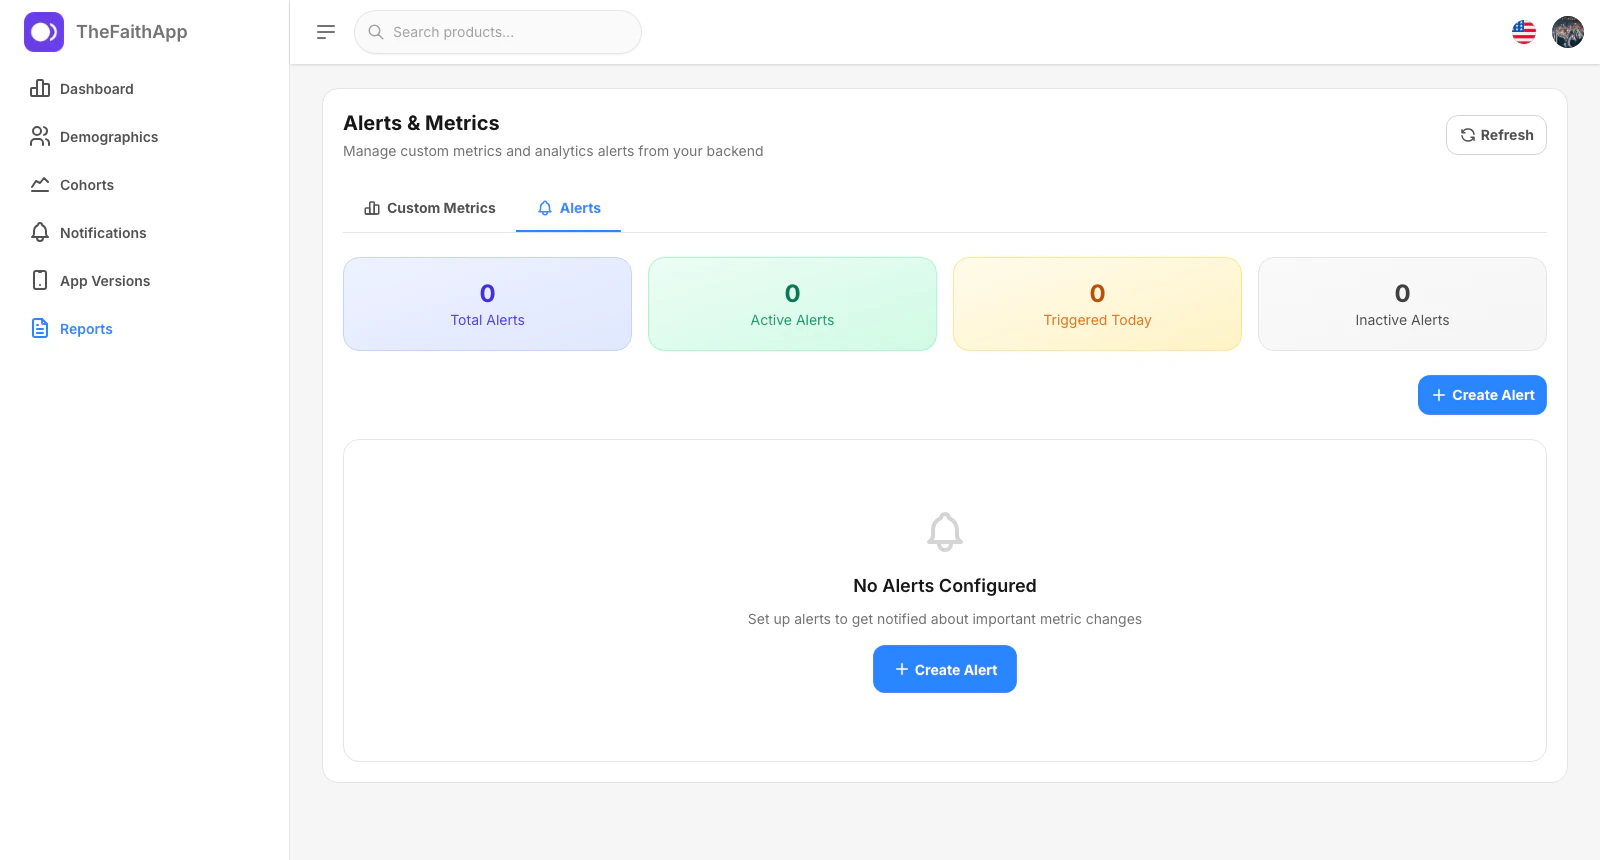 ### What You Can Do
* Review total and active alerts
* See how many alerts triggered today
* Create a new alert
* Activate or deactivate alerts after they exist
* Test alerts after setup
### Steps
1. Open `Analytics`.
2. Click `Reports`.
3. Open the `Alerts` tab.
4. Review the alert summary cards.
5. Click `Create Alert` when you want to add a new threshold rule.
### Notes
* Alerts are best for ongoing monitoring rather than one-time reporting.
## Creating An Alert
Use the alert drawer when you want to define the metric, threshold, and recipient list for analytics monitoring.
### What You Can Do
* Review total and active alerts
* See how many alerts triggered today
* Create a new alert
* Activate or deactivate alerts after they exist
* Test alerts after setup
### Steps
1. Open `Analytics`.
2. Click `Reports`.
3. Open the `Alerts` tab.
4. Review the alert summary cards.
5. Click `Create Alert` when you want to add a new threshold rule.
### Notes
* Alerts are best for ongoing monitoring rather than one-time reporting.
## Creating An Alert
Use the alert drawer when you want to define the metric, threshold, and recipient list for analytics monitoring.
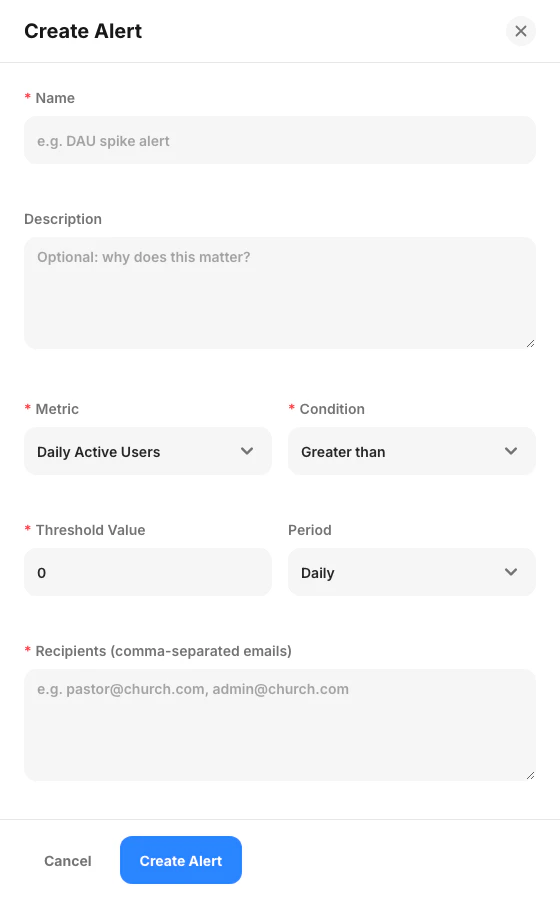 ### What You Can Do
* Name the alert
* Add a short description
* Choose the metric to monitor
* Choose the condition
* Set the threshold value
* Set the period
* Add recipient email addresses
### Steps
1. Open `Analytics`.
2. Click `Reports`.
3. Open the `Alerts` tab.
4. Click `Create Alert`.
5. Fill in the metric, condition, threshold, and recipients.
6. Save the alert.
### Notes
* Recipient emails determine who receives the alert notification.
## Current Product Notes
* `Engagement` and `Content` analytics are part of the main dashboard tabs rather than separate left-nav pages.
* The current analytics web workspace exposes custom metrics and alerts, but it does not currently expose a separate scheduled reports screen in the admin UI we reviewed.
* Analytics tracking endpoints support app and integration data collection, but they belong in the API reference rather than the non-technical product guide.
### What You Can Do
* Name the alert
* Add a short description
* Choose the metric to monitor
* Choose the condition
* Set the threshold value
* Set the period
* Add recipient email addresses
### Steps
1. Open `Analytics`.
2. Click `Reports`.
3. Open the `Alerts` tab.
4. Click `Create Alert`.
5. Fill in the metric, condition, threshold, and recipients.
6. Save the alert.
### Notes
* Recipient emails determine who receives the alert notification.
## Current Product Notes
* `Engagement` and `Content` analytics are part of the main dashboard tabs rather than separate left-nav pages.
* The current analytics web workspace exposes custom metrics and alerts, but it does not currently expose a separate scheduled reports screen in the admin UI we reviewed.
* Analytics tracking endpoints support app and integration data collection, but they belong in the API reference rather than the non-technical product guide.